
Guide
How to Calculate Cost per Signed Case for a Personal Injury Firm: A Channel-by-Channel Worksheet
A channel-by-channel worksheet for personal injury firm owners: match inquiries to signed retainers, allocate acquisition costs, check source completeness, and connect cost per signed case to collected fees.
Published November 10, 2026 · 16 min read
Put this guide to work
Keep the resource handy as you work through the steps.

Your firm can see what it spent on advertising and how many calls came in. The harder question is which inquiries became signed personal injury matters—and what the firm spent to acquire them.
Cost per signed case gives you a way to answer that question using your own records. Start with inquiries received during a defined period, follow those inquiries through a stated observation date, and compare the costs and signed cases assigned to each channel. Then check how much of the picture remains unresolved.
This worksheet is designed for a firm owner to review with the people responsible for marketing and intake. It also keeps a second question separate: what fees did those signed matters eventually produce? A signed retainer is a useful acquisition milestone, but it is not a collected fee.
Tip
Want the shortcut? Get the free cost-per-signed-case calculator: pick your region and case type, enter spend, leads and signed cases by channel, and see how your numbers compare with published benchmarks, each listed with its source and sample.
Start with a definition of cost per signed case
The basic calculation
For a group of inquiries received during the same period:
Key number
Cost ÷ signed cases Cost per signed case = acquisition costs assigned to the inquiry cohort ÷ eligible signed cases from that cohort.
State the date through which you counted signings. For example, a January inquiry may become a signed matter in February; it belongs in the January inquiry cohort when you review that cohort at the end of March.
This extends the channel and intake measurement approach described by Allegiant Digital Marketing by matching signings back to the inquiries being measured.
If a channel has zero signed cases, its cost per signed case is N/A. Show its spend and zero signings rather than dividing by zero or describing the cost as $0.
Decide what counts as a signed case
For this worksheet, count one eligible personal injury matter when the firm has:
- A unique matter ID.
- Evidence of a signed retainer.
- A signing date on or before the observation date.
Before calculating, document how your firm treats co-counsel matters, matters referred out, cancelled retainers, and multiple clients from one incident. For example, if two injured passengers from one collision each sign a separate retainer, decide whether your reporting unit is a client matter or an incident, then apply that rule consistently. If you report by incident, count an incident once when any of its matters is signed, and use the same unit in every rate. Keep the underlying records so you can review the decision.
Show two cost views
Use both views when discussing channel performance:
- Media-only cost: direct advertising and lead-purchase spend assigned to the channel.
- Fully loaded acquisition cost: media-only cost plus the firm’s documented allocation of agency fees, software, and acquisition-related staff costs.
Inovista also distinguishes media costs from a fully loaded acquisition view. The categories you include are a firm decision; use the same scope across channels and disclose material exclusions.
Build an inquiry cohort before comparing channels
Choose an inquiry period and an observation date
Group inquiries by their first inquiry date. For a January cohort, include eligible first inquiries received from January 1 through January 31, then count their signed cases through a later date—for example, March 31.
Revisit that same cohort as pending inquiries resolve. A February signing from a January inquiry remains in January’s cohort; it does not become a February inquiry.
Match costs to the cohort
As a practical proxy, assign acquisition spending incurred during the inquiry period to that period’s cohort. Record the method beside the results.
This is an approximation. January SEO spending, for example, may support visibility beyond January, while a January organic inquiry may reflect work performed earlier. Keep a separate calendar-month cash-spend report so the cohort worksheet is not mistaken for a cash-flow statement.
Label immature cohorts
Every report should show:
- Inquiry period and observation date.
- Time elapsed since the inquiry period ended.
- Pending inquiries.
- Known unresolved matching or source issues.
A recent cohort with pending retainers can change. Compare it cautiously with an older cohort that has had more time to resolve.

Complete the channel worksheet
Enter spend and inquiry counts
Create a row for each channel your firm uses: paid search, Local Services Ads where applicable, organic search, referral, other, and unknown. For each row, enter direct spend, allocated shared costs, unique inquiries, qualified inquiries, signed cases, and pending inquiries.
A channel with known inquiries but no defensible assigned cost needs an explicit N/A cost result. A genuine $0 cost is different from an unknown or unassigned cost.
Define qualification before calculating conversion
Write down the criteria your intake team uses to qualify an injury inquiry. Your definition might consider practice fit, location, and whether the firm elected to pursue the matter. Record disposition reasons, including when the firm declines or cannot reach the person.
Use consistent definitions for these calculations:
- Qualification rate = qualified inquiries ÷ unique inquiries.
- Qualified-to-signed rate = signed cases ÷ qualified inquiries.
Show N/A when the denominator is zero. If your firm can create multiple counted matters from one inquiry, document that relationship: signed matters divided by qualified inquiries may exceed 100% and should not be interpreted as a person-level conversion rate.
Start with a published legal advertising benchmark
Connect that lead cost to the percentage of inquiries your firm signs. This is the step a cost-per-lead report leaves out.
Search-ad cost per signed case = cost per lead ÷ inquiry-to-signed conversion rate
| Inquiry-to-signed rate you enter | Calculation using the $131.63 benchmark | Search-ad cost per signed case |
|---|---|---|
| 10% | $131.63 ÷ 0.10 | $1,316.30 |
| 20% | $131.63 ÷ 0.20 | $658.15 |
| 30% | $131.63 ÷ 0.30 | $438.77 |
The conversion-rate column is a scenario input. Replace it with your firm’s recorded rate for the same inquiry cohort. Add agency, intake, software, and other acquisition expenses to calculate the fully loaded result.
Read the result alongside case mix and completeness
Before changing a budget, check whether the channels cover the same inquiry period and cost categories, use the same qualification rules, and have comparable pending and unknown-source counts. Review the mix of matters as well: a channel’s average acquisition cost alone does not describe the eventual economics of its cases.
Warning
Channel credit is a reporting rule. Assigning a case to one source does not prove that source alone caused the client to sign.
Free download
pi-cost-per-signed-case-benchmarks.xlsx · Excel · 12 KB
How do your numbers compare?
Published benchmarks give you a reference point, not a target. The most detailed public figures come from two sources, and each comes from one agency's client data:
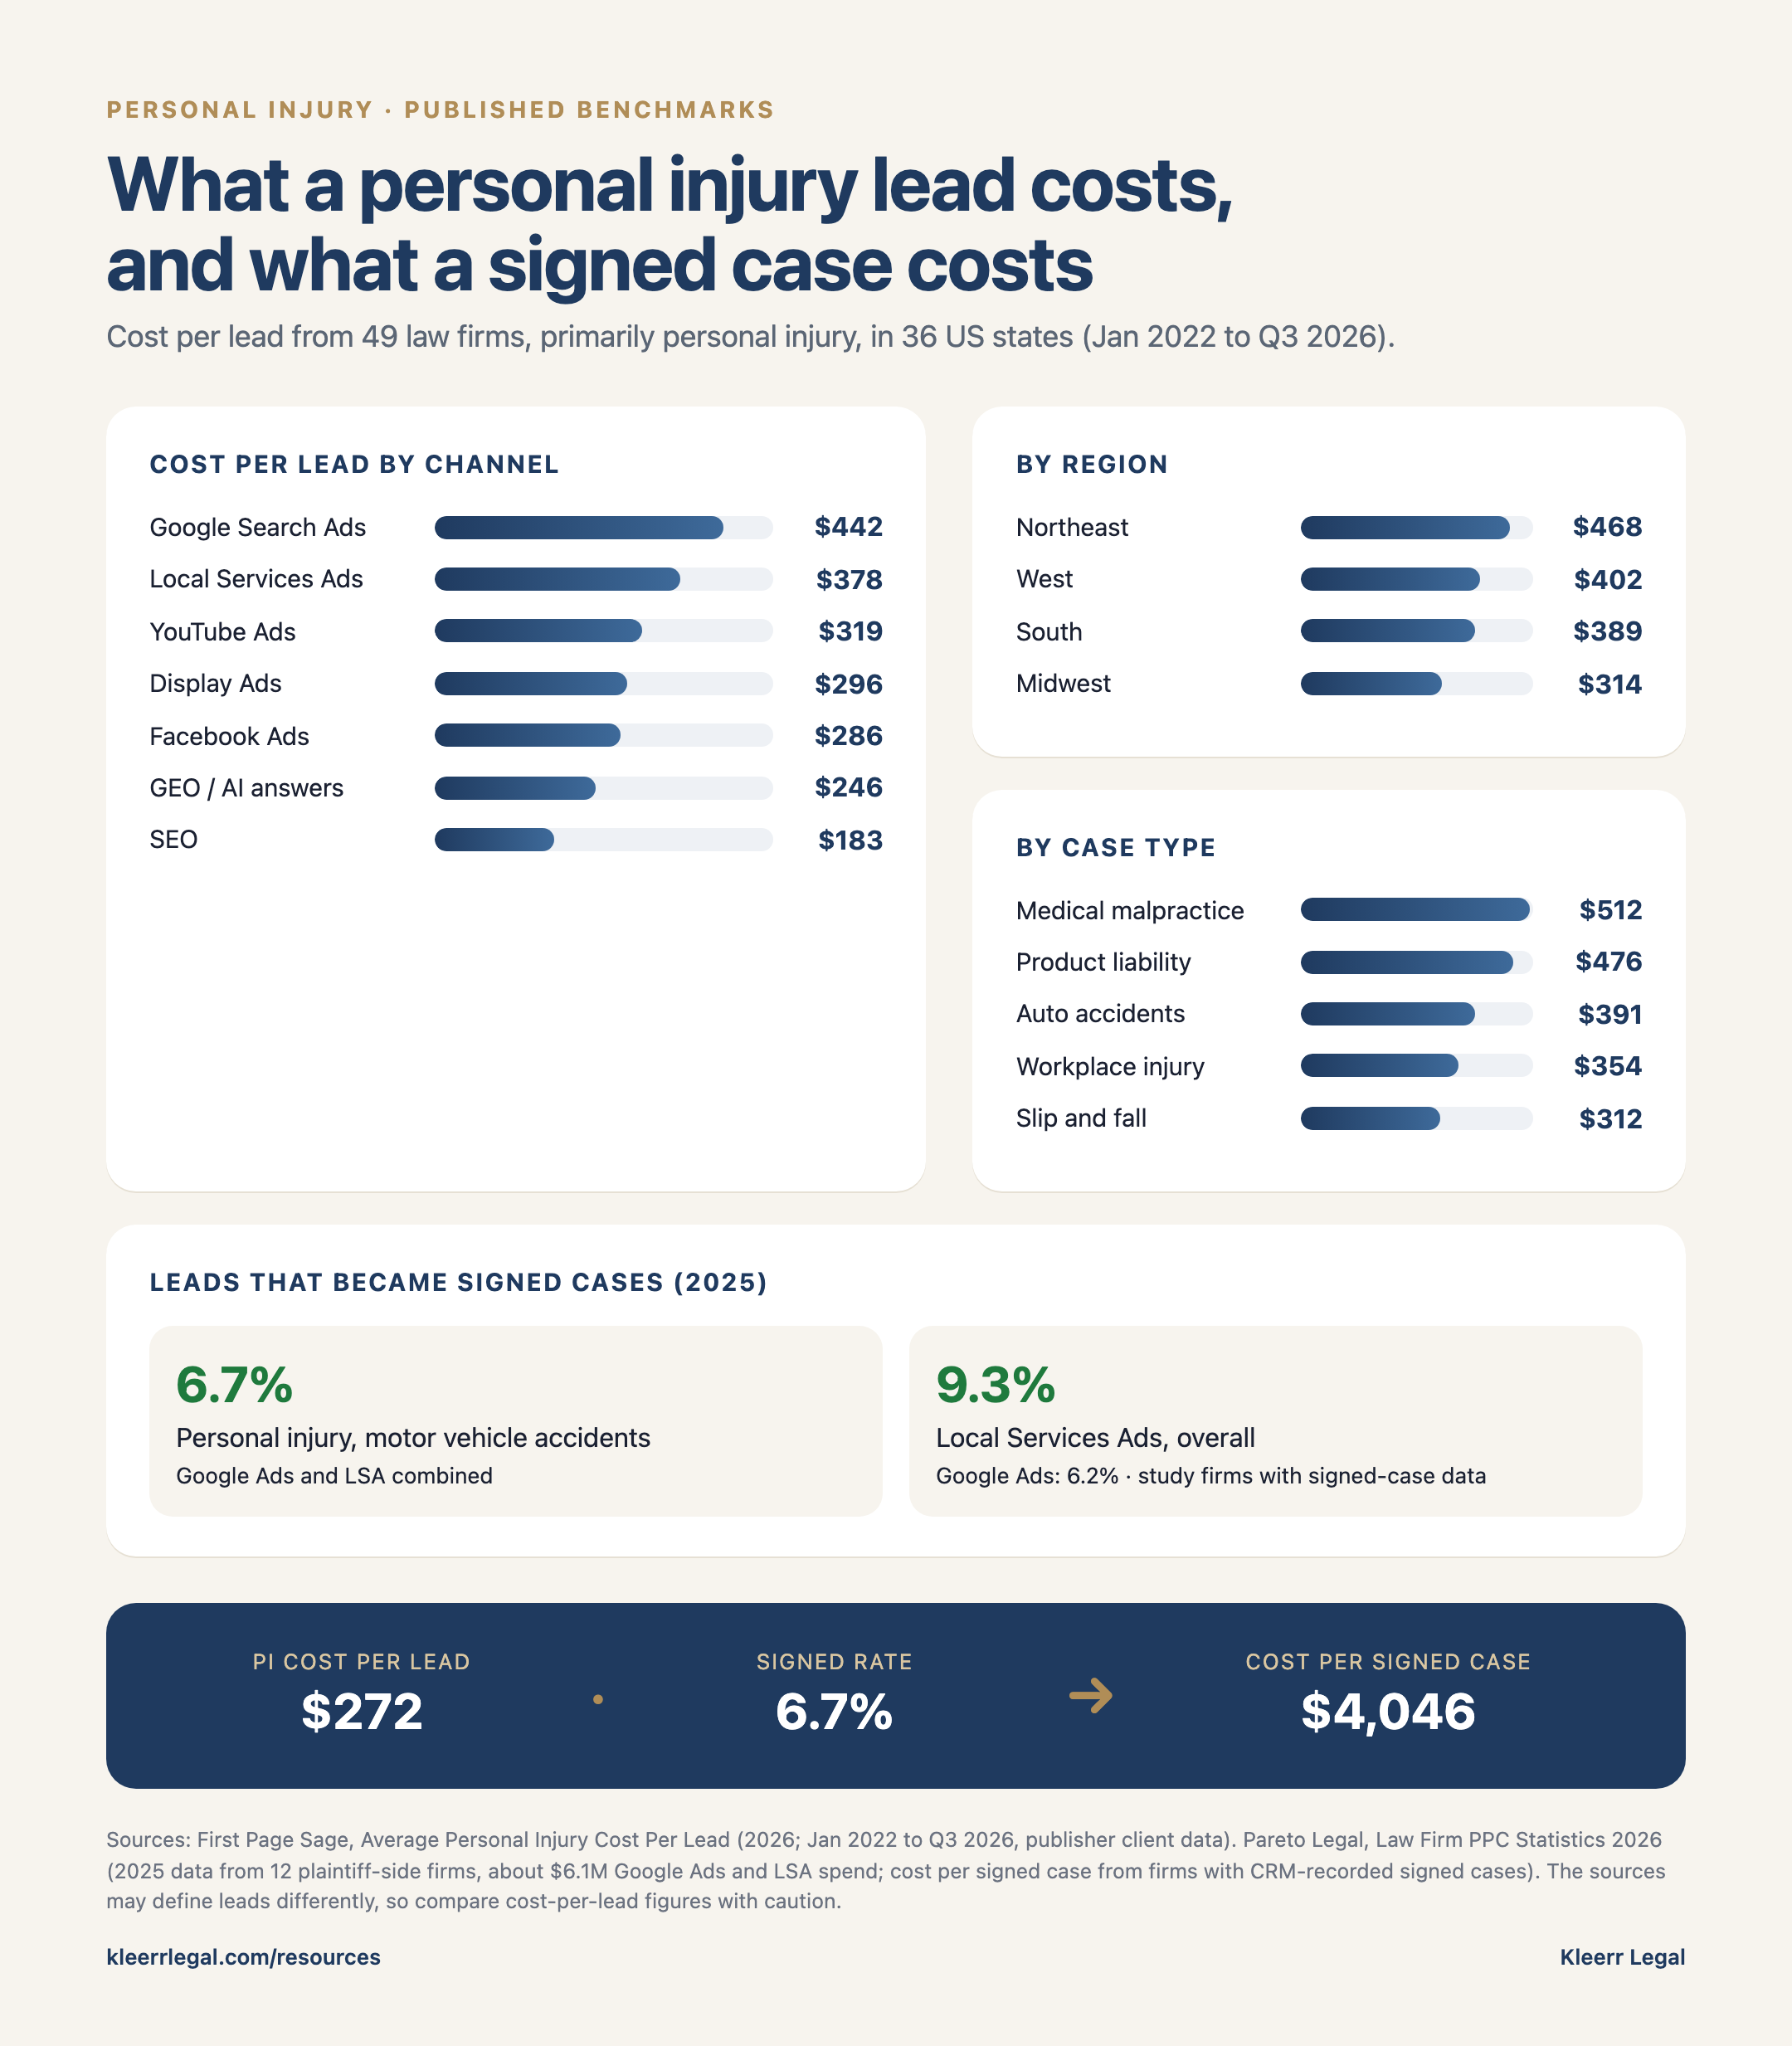
- Cost per signed case. Pareto Legal reports 2025 results from 12 plaintiff-side firms with about $6.1 million in Google Ads and Local Services Ads spend. For personal injury motor vehicle accident leads, across both channels combined, cost per lead was $272, 6.7% of leads became signed cases, and cost per signed case was $4,046. Overall, for the study firms with signed-case data, Google Ads converted 6.2% of leads at $3,812 per signed case, and Local Services Ads 9.3% at $2,354. Cost per signed case comes only from the firms whose CRMs recorded signed cases.
- Cost per lead by channel, region and case type. First Page Sage reports averages from 49 law firms, primarily personal injury, in 36 US states (January 2022 to Q3 2026): $442 for Google search ads, $378 for Local Services Ads, $286 for Facebook ads and $183 for SEO. By region, averages run from $314 in the Midwest to $468 in the Northeast; by case type, from $312 for slip and fall to $512 for medical malpractice.
Key number
$4,046 Cost per signed case for personal injury motor vehicle leads from Google Ads and Local Services Ads combined, across firms that recorded signed cases in 2025 (Pareto Legal).
The two sources may define and count leads differently, so compare their cost-per-lead figures with caution. Compare your own cost per signed case first: Pareto Legal measures it directly, while First Page Sage reports cost per lead only.
Use these figures to ask better questions, not to grade your firm. A cost per lead well below the benchmark is only good news if those leads become signed cases, and a high cost per lead can still produce an efficient cost per signed case when intake converts well.
Note
Benchmarks are averages from agencies' own client data. Your market, case mix, intake process and counting rules can move your numbers more than any channel choice. Compare your own cohorts over time first.
Allocate shared acquisition expenses transparently
Separate direct costs from shared costs
Assign identifiable costs directly where possible. Keep a separate schedule for shared agency retainers, call tracking, intake software, and acquisition-related staff time.
Include each expense once: a fee assigned directly to paid search should not also enter the shared-cost pool.
Choose and record an allocation rule
Use a basis that fits the expense and can be explained, such as documented staff time, vendor usage, or each channel’s share of eligible inquiries. Record the amount, percentages, rationale, owner, and review date.
If you allocate shared costs by inquiry volume, multiply the shared-cost pool by each channel’s share of eligible inquiries. If a cost cannot be assigned defensibly, keep it in a visible unallocated pool. Include that pool in the blended total when it falls within your acquisition-cost scope; do not force it into a channel.
Test whether the allocation changes the decision
Compare reasonable allocation methods, such as recorded staff time and inquiry volume. Keep total acquisition costs and the cohort’s signed-case count fixed. The blended cost per case stays the same; only the channel split changes.
If the ranking changes with the allocation method, review the underlying cost drivers before moving budget. Record the method alongside the result so your team and agency can repeat the calculation.
Put this guide to work
Keep the resource handy as you work through the steps.
Reconcile calls, intake records, and signed retainers
CallRail’s Sullivan Law report describes connecting marketing, intake, and signed-case information at a family law firm. The field map below adapts that connected-record idea for a personal injury workflow. It is a proposed design to validate against your firm’s systems and practices, not evidence of personal injury results.
Map the fields across systems
| Record | Fields to capture or link | Review question |
|---|---|---|
| Advertising or source data | Source, channel, campaign, period, direct spend | Can the expense and reported source be assigned consistently? |
| Call or form interaction | First inquiry timestamp, call or form ID, available source and campaign, contact or incident match key | Is there an intake record for this interaction? |
| Intake | Intake ID, linked interaction IDs, first inquiry date, qualification disposition, follow-up status | Is this a new inquiry or another interaction about an existing one? |
| Signed-retainer evidence | Intake or matter ID, retainer status, signing date, evidence reference | Is there evidence of a signed retainer by the observation date? |
| Matter record | Matter ID, linked intake ID, matter status, client or incident key | Has this eligible matter already been counted? |
| Exception log | Exception type, proposed match or correction, decision, owner, date | Who will resolve the discrepancy and update the cohort? |
Use identifiers and access controls appropriate to your firm’s records. A match key should support review; it should not make an uncertain identity match automatic.
Turn interactions into unique inquiries
Keep the original calls and forms, then link interactions that belong to the same inquiry under your documented rule. Send uncertain matches to a review queue.
For example, an injured person calls twice about a collision and later completes a form. Intake confirms that all three interactions concern the same person and matter, so the worksheet records one inquiry, while retaining all three interaction IDs.
A different situation needs judgment: two family members may contact the firm about one incident, or the same person may use different phone numbers. Record why records were linked or kept separate. Do not merge them automatically when identity or the matter relationship is uncertain.
Assign channel credit once and preserve uncertainty
Choose a primary channel rule for the worksheet—for example, the first identifiable source associated with the first inquiry—and record any override and its reason. Preserve available first-touch and later-touch fields for investigation.
If the evidence does not support a channel assignment, use unknown. Do not silently spread unknown cases across known channels.
Google Analytics distinguishes first-user, session, and event-level traffic-source dimensions. Those fields describe different scopes, so do not substitute a session source for a first-user source without documenting the reporting rule.
Run a recurring reconciliation
Each month, have marketing and intake leads:
- Compare calls and forms from the inquiry period with intake records; investigate unmatched interactions.
- Review duplicate candidates and document whether records were linked or kept separate.
- Review missing sources and any proposed channel overrides.
- Compare signed-retainer evidence with intake and matter records; investigate unmatched retainers, duplicate signings, and status conflicts.
- Record each correction, decision, owner, and date; recalculate affected cohorts.
For example, a retainer may arrive under a different phone number from the original intake record. After manual review confirms the match, link the signed matter to the original inquiry, record the evidence and reviewer, and update that inquiry’s cohort. Until then, keep it in the exception queue.
Make measurement quality visible
Report both measures:
- Inquiry source completeness = unique inquiries with an assigned source ÷ unique inquiries.
- Signed-case source completeness = signed cases with an assigned source ÷ signed cases.
Show unmatched records and pending inquiries next to both percentages. If either denominator is zero, show N/A.
Improve intake without confusing conversion with lead quality
Find where inquiries stop progressing
For each cohort, show the number of inquiries at each stage:
- Unique inquiries.
- Contacted.
- Qualified inquiries.
- Retainers sent.
- Signed inquiries (inquiries that produced at least one signed matter).
Count each cohort inquiry in every stage it reached by the observation date, so a signed inquiry also counts as contacted, qualified, and sent a retainer. Then divide each stage by the stage before it, showing N/A when that stage is zero. If one inquiry can produce more than one signed matter, report signed matters separately rather than as a funnel stage. Add disposition, decline, and no-response reasons. Define each stage before comparing periods, and preserve the distinction between a firm declining a matter and a prospective client not responding.
A low signed-case count may warrant a closer look at qualification, follow-up, retainer delivery, or the inquiries themselves. The stage counts help you choose where to investigate; they do not establish the cause on their own.
Choose one measurable operational change
Suppose an owner assigns an intake lead to review missed calls and make sure each one has a documented follow-up disposition. Compare the relevant stage conversion for cohorts before and after the change, while noting differences in channel mix, case mix, observation time, and pending records.
This is a proposed test. A change in conversion would need interpretation; it would not automatically prove the follow-up process caused it.
Connect acquisition cost to collected fees
Follow the same signed matters to resolution
For each signed matter, add the outcome, resolution date, gross recovery where applicable, firm fee, collected fee, collection date, and relevant costs from the firm’s records.
A settlement or other gross recovery is not the same figure as the firm’s fee. The ABA’s Model Rule 1.5 addresses fee agreements, including contingency-fee terms and expenses. Apply the agreement and rules relevant to your jurisdiction when recording the firm’s figures.
Keep open matters visible
Separate matters that are open, closed without collection, and collected. Then calculate:
Collected fees to date per signed case = collected fees received to date from cohort matters ÷ signed cases in the cohort
Use the same counting unit as your cost per signed case. If you report by incident, this becomes collected fees per signed incident.
Important
Show collected fees and the open-matter count together. Collections from a partially resolved cohort are still developing. Keep collection timing visible in the cash-flow review.
Set an owner-specific decision threshold
Compare acquisition costs with your firm’s collected-fee history, case costs, operating costs, and cash requirements. If you choose a planning threshold, label it as the firm’s assumption, record who approved it, and revisit it as matters resolve.
There is no universal percentage in this worksheet. A threshold needs to fit the firm’s own economics and evidence.
Put the worksheet into a monthly owner review
Review exceptions before reallocating spend
Use a one-page agenda:
- Acquisition costs and their scope.
- Cohort dates, observation dates, and pending inquiries.
- Channel and blended cost per signed case.
- Unknown sources, unmatched records, and source completeness.
- Intake stages and unresolved follow-up issues.
- Shared-cost allocation and sensitivity.
- Open matters and collected-fee progress.
Decide what to maintain, investigate, or test
For each channel, write down the decision, supporting evidence, uncertainty, owner, and next review date. A small or incomplete cohort may justify further investigation rather than an immediate budget cut.
Copy the worksheet into a spreadsheet
Create five tabs using the fields below. Keep raw interaction and matter records in their appropriate systems; use the worksheet to summarize and review them.
1. Definitions
| Field | Firm entry |
|---|---|
| Inquiry definition and counting unit | Your firm’s rule |
| Qualified inquiry criteria and disposition reasons | Your firm’s rule |
| Signed-case definition and exclusions | Your firm’s rule |
| Treatment of referrals, co-counsel, cancellations, and multiple clients | Your firm’s rule |
| Primary channel rule and override process | Your firm’s rule |
| Inquiry period and observation date | e.g. January 1–31, observed through March 31 |
| Included and excluded cost categories | Your included and excluded costs |
2. Costs
Use one row per expense and include: period, vendor or cost description, direct channel or shared pool, amount, allocation basis, initial percentages and allocated amounts, alternative percentages and allocated amounts, unallocated amount, rationale, owner, and review date.
Check that allocated amounts plus the unallocated amount equal the included expense total under each scenario.
3. Cohort
Use one row per channel, including unknown. Include: cohort period, observation date, unique inquiries, qualified inquiries, signed cases, pending inquiries, direct media or lead spend, other direct cost, initial shared allocation, alternative shared allocation, and whether channel cost is known.
For each scenario:
- Media-only cost per signed case:
IF(OR(signed cases=0,media cost not defensibly assigned),"N/A",media-only spend/signed cases). - Fully loaded cost per signed case:
IF(OR(signed cases=0,channel cost not defensibly assigned),"N/A",(direct costs+allocated shared costs)/signed cases). - Blended cost per signed case:
IF(total signed cases=0,"N/A",(all included direct costs+all allocated shared costs+unallocated included costs)/total signed cases).
The names in these formulas stand in for your own cell references. A blended result understates acquisition cost if relevant expenses are missing, so list any known gaps beside it.
Include unknown-source signed cases in the blended denominator. Do not add the same shared cost twice.
4. Reconciliation
Use one row per exception: cohort, interaction or call ID, intake ID, possible duplicate or match key, matter ID, missing source, retainer-evidence reference, exception type, decision or correction, reason, owner, and resolution date.
5. Fees
Use one row per signed matter: cohort, matter ID, status, resolution date, gross recovery where applicable, firm fee, collected fee, collection date, and relevant costs. Summarize open matters, matters closed without collection, collected matters, and collected fees to date per signed case.
Prefer a ready-made version? The free calculator in this guide already includes the comparison tab and the published benchmarks. Otherwise, build the five tabs in the spreadsheet tool your firm already uses. Before relying on the numbers, test each formula against a few hand-calculated rows and confirm the counting rules with your intake lead.
Connect the records with Kleerr Legal
Kleerr Legal connects campaign spend to what happens during intake, so you can compare acquisition cost by source using qualified inquiries and signed retainers rather than lead volume.
Put this guide to work
Keep the resource handy as you work through the steps.
Free ad review
Find out what your marketing is really buying
We review your campaigns, tracking and intake outcomes, then show you where spend is wasted and what to fix before you raise the budget.
- Cost per signed case by channel
- Wasted spend and tracking gaps
- A prioritized list of fixes you keep